Tech Adoption Has Accelerated Disinformation in Developing Countries
Disinformation Toolkit 2.0
Disinformation is severe in developing and crisis-affected countries.
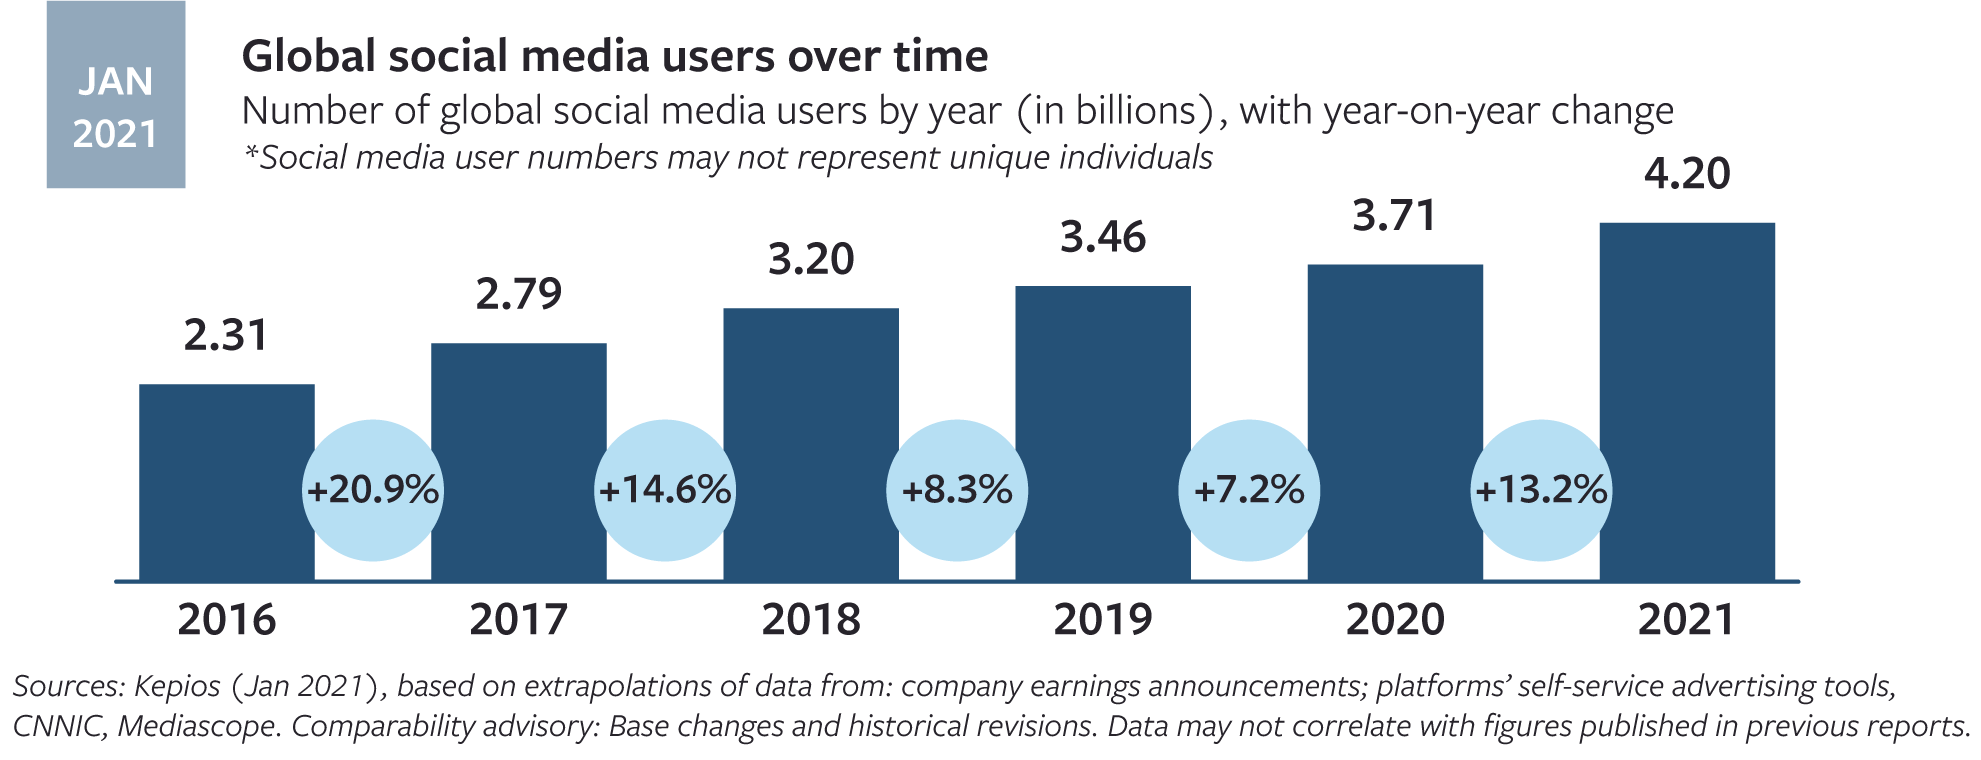
While disinformation attacks focused on the U.S. political ecosystem occupy significant public mindshare, the problem of disinformation is equally severe, if not more so, in developing and crisis-affected countries, where InterAction’s 170+ Member CSOs and NGOs are most active. To understand how and why, it is important to understand the trends that have undergirded the rapid growth of internet and social media adoption over the last five years, which has been concentrated in low- and middle-income countries. First, it is important to note that between 2015 and 2021, the global population of social media users has doubled: According to We Are Social’s January 2021 report (see graphic below), there were more than 2 billion social media users in 2015, while the January 2021 report indicates 4.2 billion users in 2021.
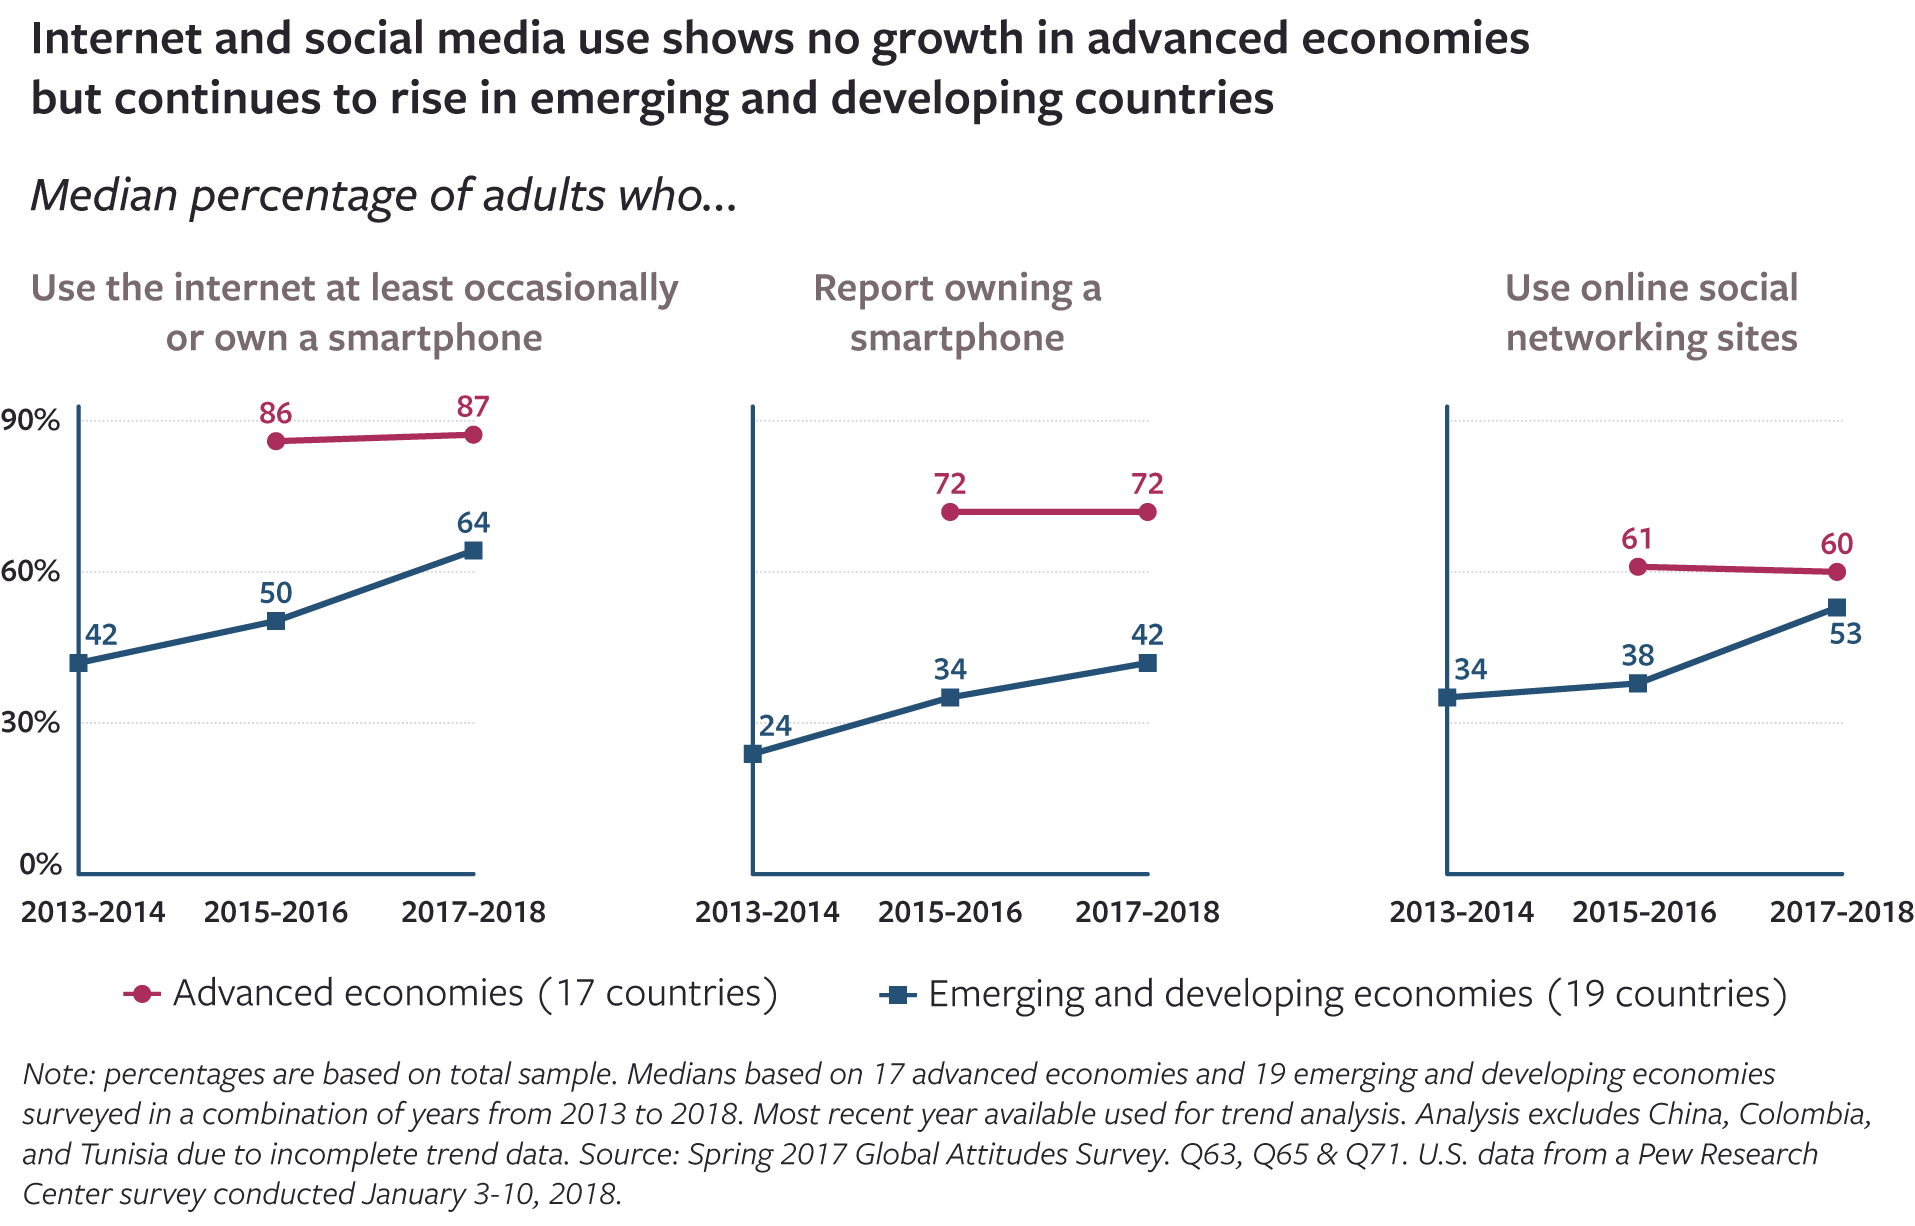
While this growth trend itself is massive, trends reported at the global level obscure the fact that the bulk of growth in adoption of internet use, smartphones, and social media has been concentrated in emerging economies. As the graphic below highlights, adoption has essentially flatlined in advanced economies while it has skyrocketed in developing countries. For example, between 2013 and 2018 (the time period the report covers), social media use in emerging economies increased from a median of 34% of the population to 53%, while in advanced economies it actually decreased. The trend is similar for internet and smartphone adoption.
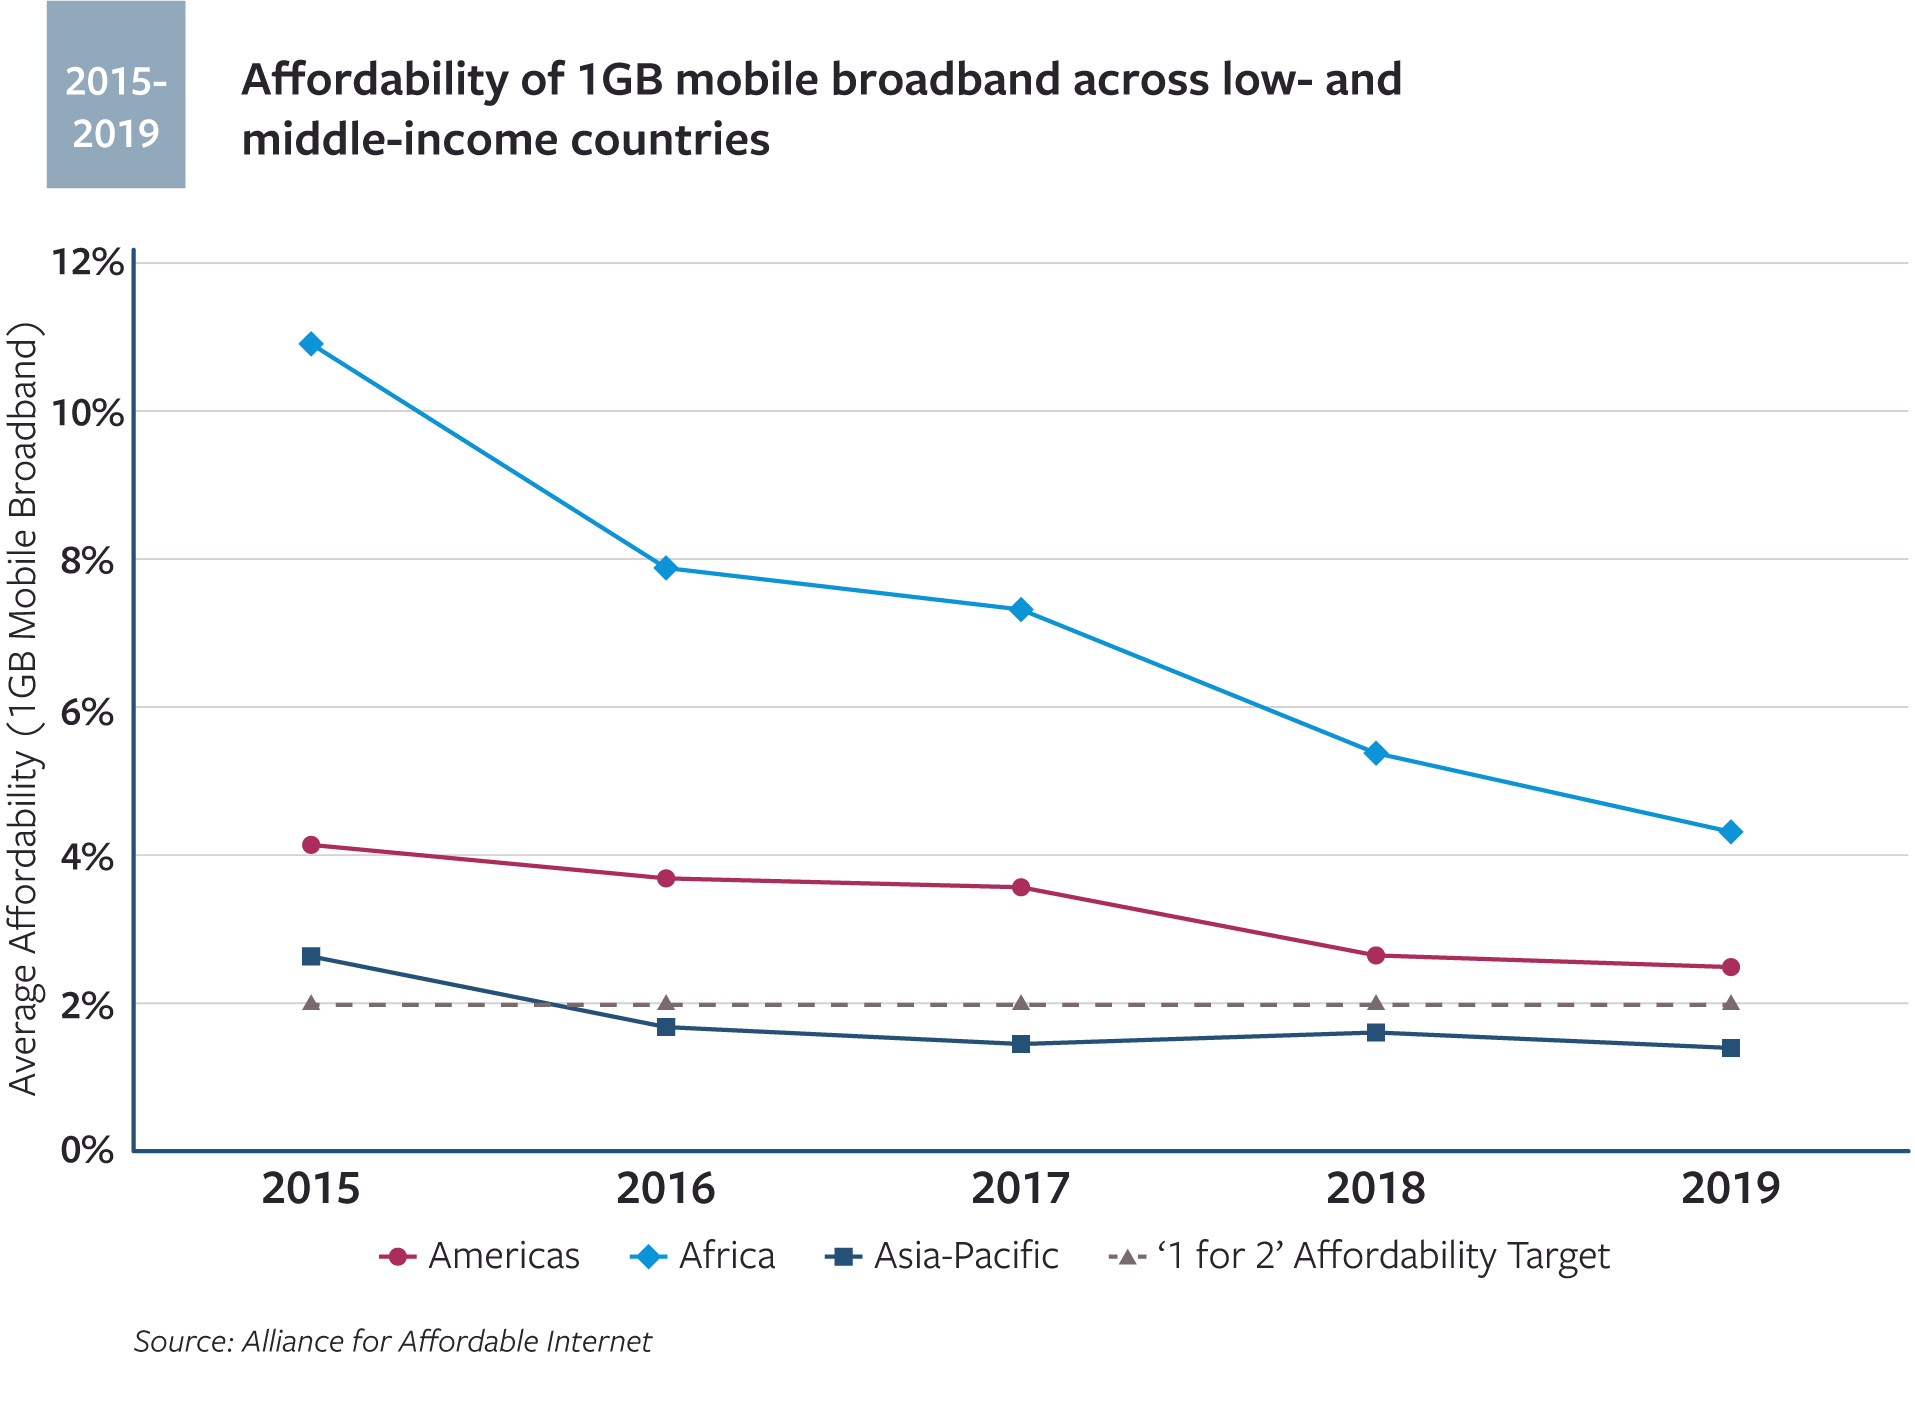
The Alliance for Affordable Internet’s 2020 Affordability Report explains this trend: Following the U.N. Broadband Commission’s definition of internet affordability as 1GB of mobile broadband for no more than 2% of the average monthly income, “On average, prices in low- and middle-income countries have become more affordable, moving from 7.0% of average monthly income in 2015 to 3.1% in 2019. Countries like Rwanda, Ecuador, and India have seen the cost of 1GB mobile broadband come down by more than 60% during this time period.”
On average, prices in low- and middle-income countries have become more affordable, moving from 7.0% of average monthly income in 2015 to 3.1% in 2019.
-Alliance for Affordable Internet, 2020 Affordability Report
This trend is the result of a confluence of factors, including:
- Regulatory changes such as market liberalization and accompanying robust investments in physical network infrastructure;
- Mobile network operators competing to expand data services and capture market share;
- Economies of scale resulting in cost reductions for each additional user;
- The advent of cheap smartphones, which typically come pre-loaded with Facebook, WhatsApp, and other social media and messaging apps;
- Programs like Facebook’s Free Basics, which provides a free, simplified version of the internet in developing countries.
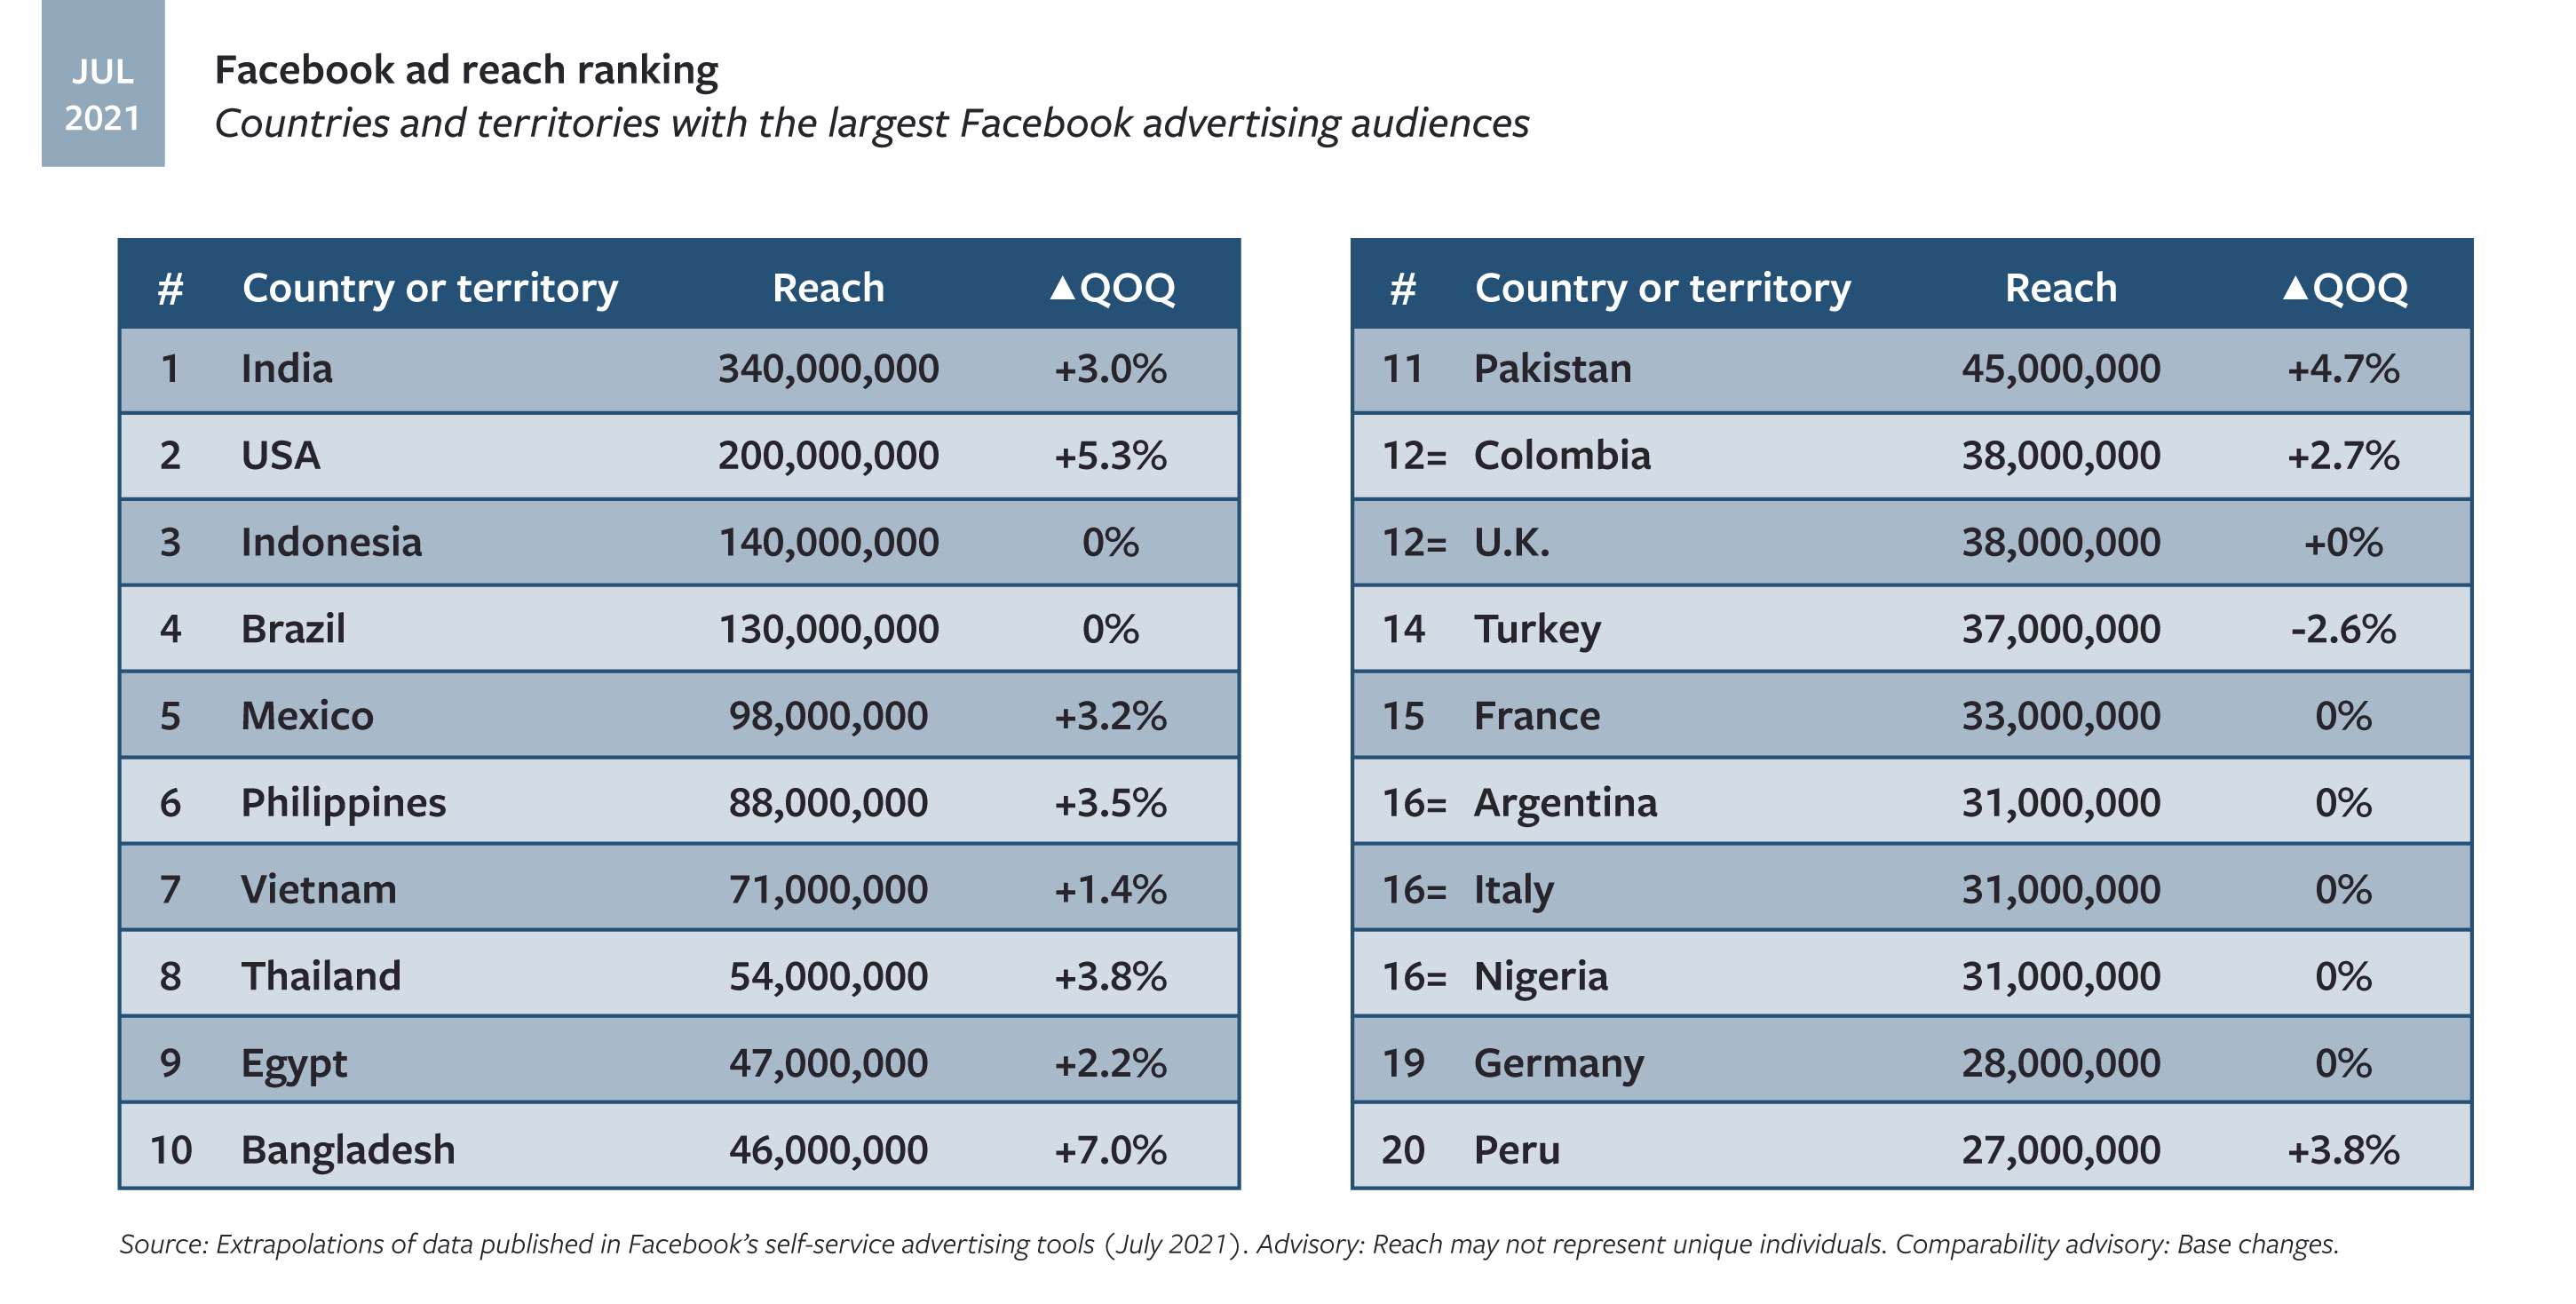
As a result, 9 of the 10 countries with the highest number of Facebook users are classified by the World Bank as middle income. Further, 14 of the top 20 are middle income, and 9 of the top 20 are lower middle income in contrast to the earlier days of Facebook, when usage was concentrated in high-income countries. Of Indonesia’s 270 million people, more than half have an active Facebook account. Of Mexico’s 128 million, more than 70% have a Facebook account.
Many of these countries are strategic priorities for the United States. In total, they received foreign aid obligations totaling $2.7 billion in the 2020 U.S. foreign aid budget. They also include 8 of the top 40 recipients of the 2020 U.S. foreign aid budget by obligation.